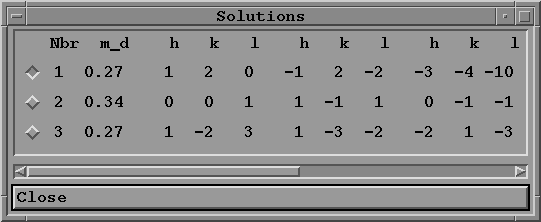


The indexes found for each experimental spot are displayed. To select one of the solutions for simulate, just click on the corresponding line. In the example shown above, one shall first try solution 2 because it is the one giving the lower Miller indexes for the spots.
By comparing the experimental diagram to the simulated one for each possible solution, you will find the orientation of the crystal.