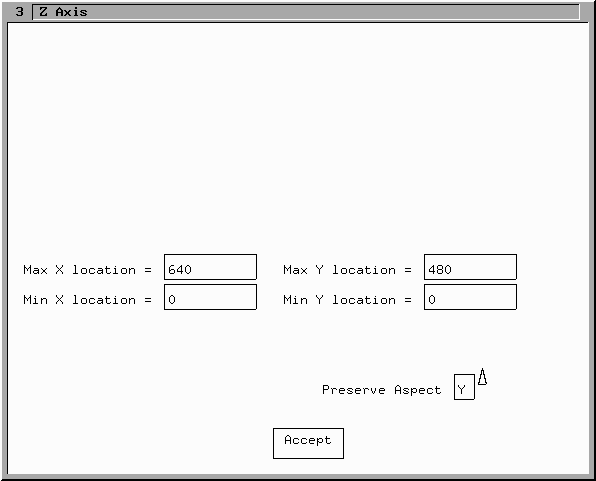
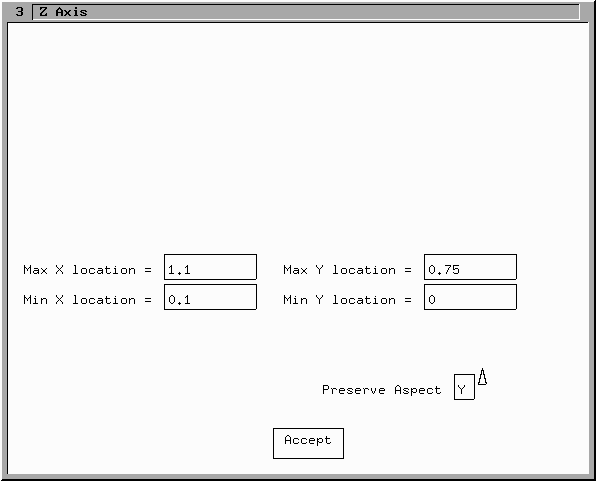
The Z-Axis window is show below in its default condition for an image file:

If the raster file is an image (IMG, CMP or SGI), then the location of the image in the X-Y plot is not specified in the file. The image above shows the defaults for the IMG and CMP images, the defaults for an SGI file depend on its size. The choice of 640x480 for the image size (even though these images actually have 512x480 pixels) results in the images being displayed with the proper aspect ratio when plotted with X and Y axes that have a 1:1 aspect ratio (which PSALL automatically does). (An aspect ratio of 1.0 is used for SGI files.) If the actual size of an image is known, say from the magnification of the optical system that was used to produce the image, the X and Y maximum and minimum value can be changed to give a plot with real units for the X and Y axes. This is done by entering the number directly in the text boxes as described below.
If the preserve aspect ratio choice is Yes then changing the X and Y max/min values does not change the aspect ratio of the image. Instead changing these values results in appropriate changes to the other values to preserve the aspect ratio. If the preserve aspect choice is set to no, then any values can be entered into these text boxes and no ajustments are made.
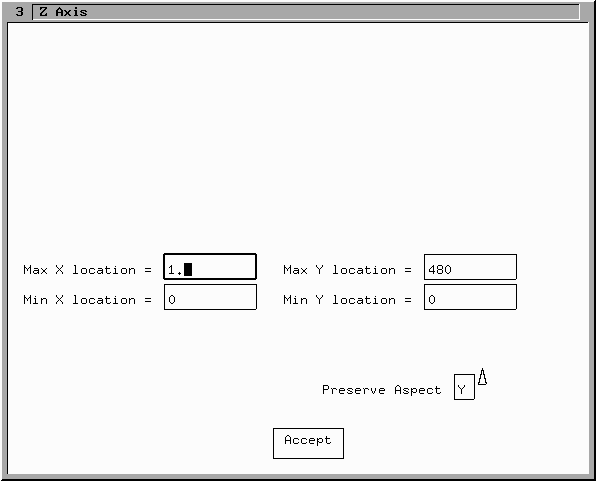
It is suggested that the image first be sized correctly by entering the proper values in either the X or Y MAXIMUM text boxes. Note that entering numbers in the maximum text boxes has a different effect from entering a number in the minimum text box. The process of entering 1.0 as the maximum X value is shown below.
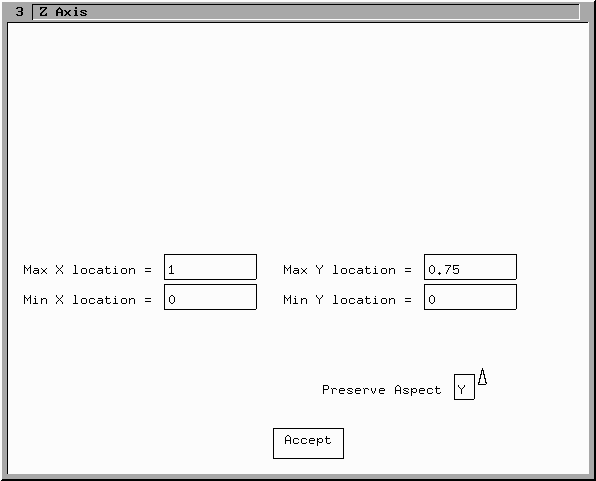
The Y maximum value is then automatically changed to keep the aspect ratio of the image correct:
The next step to to locate the image correctly in the x-y plane. This is done by entering numbers in either of the X and/or Y MINIMUM text boxes. A number being entered in the X minimum text box as shown below.
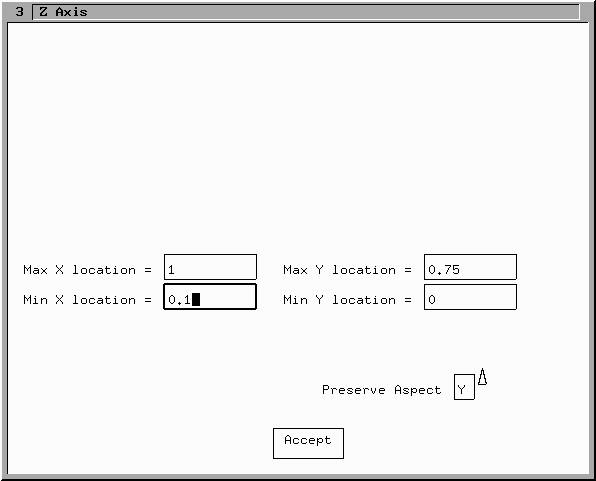
This results in the X Maximium value automatically updating to keep the width of the image the same. Similarly entering a Y minimum value causes the Y maximum value to be automatically changed as well:
Thus to summarize: