PIV (Particle Image Velocimetry) Principle
The principle of PIV is quite simple. Imagine you take a photo of a car on the freeway and then 1 second later to take another photo. You can determine the speed and direction of the car by measuring the distance it traveled between the 1st photo and the 2nd, and dividing by 1 second. This is exaclty how PIV works, but instead of one car, you have thousands of tiny particles (called "seed particles," or "tracers") that you assume are faithfully following the flow. PIV can be used on a number of fluid flow applications, the most common of which are air and water. Airflows are usually "seeded" with small droplets (0.2 - 5 micron) of oil or water. Water and other liquid flows are seeded with small (10 - 100 micron) solid particles. The velocity fields obtained from PIV can be used to study and optimize fluid flows, for example in aerodynamics, bioligical heart flow, or microfluidic devices among others.
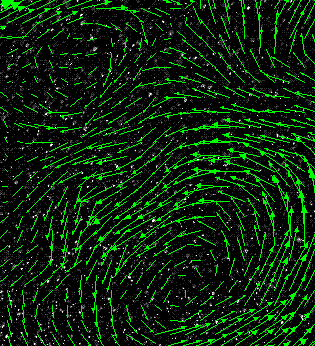
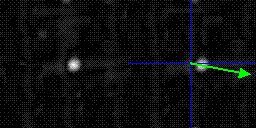
Here is a typical PIV image with vectors overlaid on top of it. Click on the image to see it without vectors, and toggling between the first and second frames. It's not hard to see where each particle has gone from frame 1 to frame 2. The trick is developing software that can do the same thing our eyes can do quite easily.
First a couple of comments on the imaging device, the camera. Typically PIV uses cameras with frame rates on the order of 15 - 30 frames per second (fps). Of course for very high-speed flows (or for very high magnifications), it is important to have a very short time between images. The problem is that the exposure times of the camera are too large to get sharp, clear particle images; they would appear more like streaks. In order to "freeze" the particle images at a specific time, a very short laser pulse is used. In this way, the camera can receive a lot of light (enough to image the particles on the sensor) in a very short amount of time (on the order of 10 nanoseconds), to freeze the particles in each image. You can imagine that the timing of all of these events is very important. The synchronizing of the camera shutters and the laser pulses is very crucial to accurate measurements.
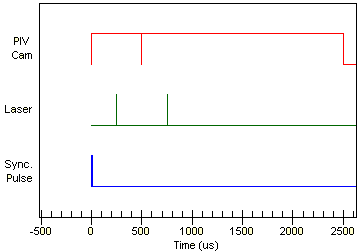
A typical timing diagram can be seen to the left. The blue line represents the triggering device, when it goes down, the sequence begins. Notice that the timing units are in microseconds, so the whole sequence happens in a fraction of a second. The green vertical lines represent laser pulses, and the red line represents the camera exposures; when the red line is up, the camera exposure is on, when the line is down, the exposure has stopped. Notice that there are 2 camera exposures, and that the 2 laser pulses "straddle" the interframe time between the 2 camera exposures. This is sometimes referred to as "frame-straddling."
So a PIV system consists of the following components: a camera, a laser, a synchronizing device, and software to analyze the images.
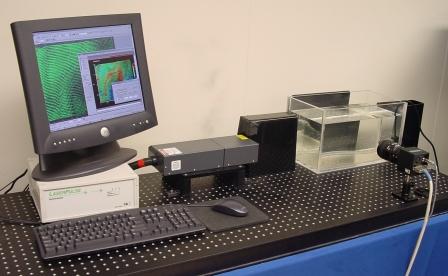
The picture to the left represents a typical 2D PIV system. There are a couple of things to note. The first is that at the laser beam exit are placed several lenses (one cylindrical and one spherical) to convert the circular laser beam into a thin laser sheet (typically around 0.5 mm). That way, the velocity in only one plane is measured. On a related note, with one camera, you are only able to measure velocities in 2 directions, horizontally and vertically. If there are particles moving directly toward or away from the camera, you will not be able to measure them.
After the images are captured, you need some way to analyze them to give you the individual particle displacements. There are several techniques that are used to do this. Classic PIV uses a cross correlation method, whereby each image is segmented into smaller "interrogation regions." Then the velocity is calculated individually for each interrogation region in the first and second images by correlation.
There are lot of good references that cover these correlation techniques, but in a simplified way, you can think of it as multiplying the intensity of each pixel by the intensity of every other pixel in the interrogation region, and creating a plot. This is called the correlation map. If the particles don't move at all from frame A to frame B, then you have a peak at the center of the correlation map (0,0). If every particle moves 3 pixels to the right and 2 pixels up, then you have a peak in the upper-right quadrant of the correlation map (3,2).
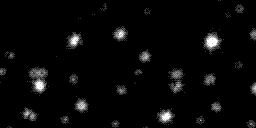
In the example to the right, the particles appear to be moving about 9 pixels to the right, and 2 pixels down, so we see a correlation peak at about (9,-2). Click your browsers "Stop" button to stop the animation. Once you know the number of pixels the particles have moved (and can relate this to a physical measurement like millimeters), then you can divide this by the time between laser pulses, and you get the velocity. In PIV, you can see that you don't get the velocity of each individual particle, rather you are averaging the velocity of all the particles in the interrogation region. So each velocity vector you have represents the average velocity of particles over an area.
To download a nice poster from TSI explaining the PIV technique, click here.