 |
|
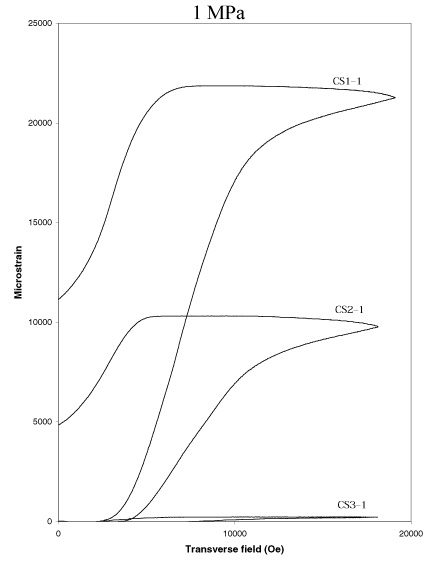
At 1 MPa, the change in slope of the strain vs. field curve with increasing aspect ratio is evident in the data. The overall performance decreases sharply with aspect ratio as well. |
|
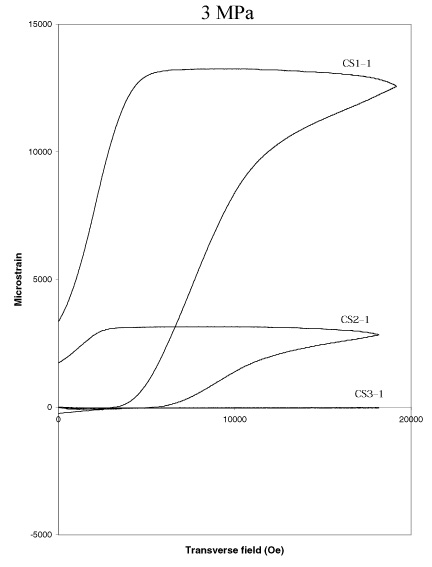
At 3 MPa, the change in slope of the strain vs. field curve with increasing aspect ratio is also quite significant, and the performance of all specimens decreases again, with almost no response from specimen CS3-1. |
|
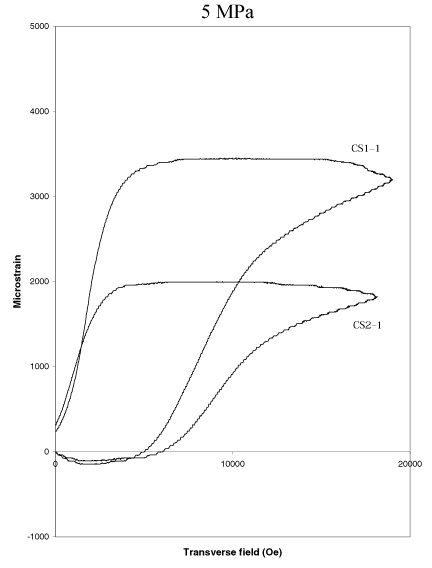
At 5 MPa, the change in slope is not as large as the previous graphs, but is still present. No 5 MPa curve was performed with specimen CS3-1, so none is shown on the graph. |