Martensitic Magnetomechanical Measurements

Results of Applied Stress Experiments


The follow graphs show the strain vs. field curves for specimens CS1-1 and CS2-1 at loads of 1, 3, and 5 MPa. The tables show the calculated value of initial rotation q prior to variant rearrangement (calculated from the expression on the previous page using volume fraction k derived from the initial strain).

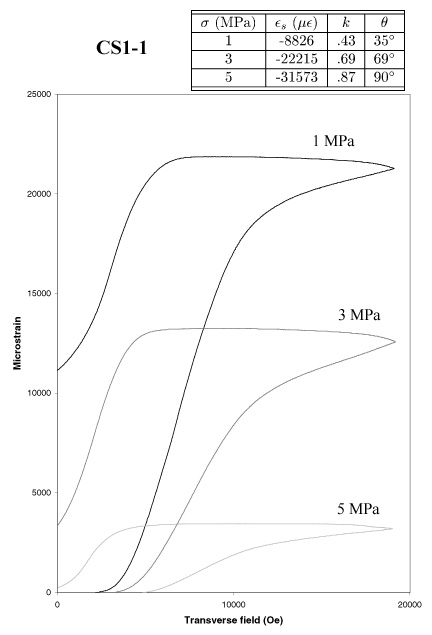
For specimen CS1-1, the initial plateau region increases with applied load as expected, and the total induced strain decreases.


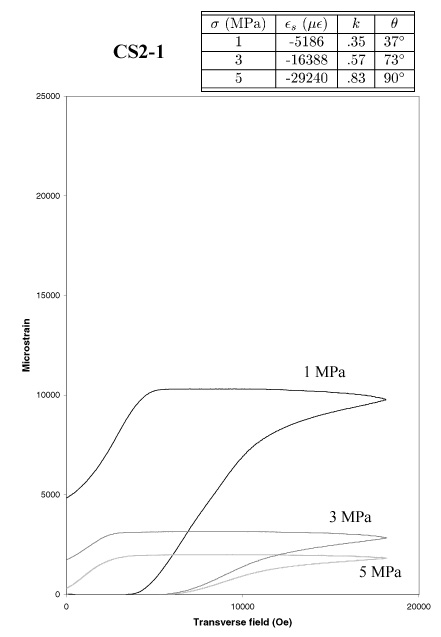
Similar results for specimen CS2-1, however the induced strains are smaller in general compared to CS1-1.


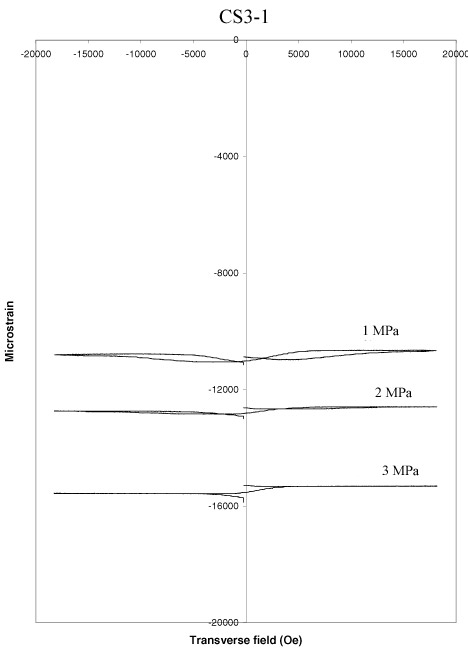
Specimen CS3-1 showed very little induced strain, and was only tested to 3 MPa as it had hit its blocking stress at that point. The small strains make any trends here difficult to spot.


Prev     Next

Magnetomechanical pages:

Go to:


My bio         Home page